
White Papers
Introduction
The Twoobii-OneWEB service operate on the Eutelsat OneWEB platform which is a LEO satellite service. The service is supported by a satellite constellation of estimated 648 satellites at an altitude of 1200km.
The constellation consists of 12 orbits with 54 satellites each. A OneWEB User Terminal (UT) switches to a new satellite every 3 minutes with a minimum elevation angle of 30° with the horizon. The RF link between the UT and the satellite moves constantly and therefor the fading effect during rain conditions at the UT will also change. It is also noteworthy that that the Twoobii-OneWEB service is supported from the Hartebeeshoek Satellite Network Portal (SNP) or Ground Station (GS). The SNP operates in the Ka-band frequency range. The OneWEB User Terminal (UT) operates in the Ku-band frequency range with a diverse distribution of UTs over South Africa. For the purpose of this paper, a UT located in Centurion, Gauteng will be used as reference.

Rain Fade calculations
Rain Fade is the attenuation in dB of the signal due to the signal through the rain. Rain fade is a function of the rain rate and the path length of the signal through the rain. Rain rate is expressed in mm/h with various sources that identify different precipitation intensities that range from Very Light Rain (rainfall amount in a day between 0.1mm to 0.9mm) to Extremely Heavy Rain (rainfall amount in a day is equal or more than 151mm). For the Gauteng and surrounding areas, historical statistics indicate that average rainfall over the entire area exceeded 26mm in 24 hours only 1% of the time. This is classified as a ‘heavy rainfall event’ over a the entire 16500km² area. To determine the rain rate on a specific location will require a different generalized approach. The rain climatic zones express the average rainfall intensity for a specific time percentage (calculated over a year). Figure 2 shows the zoning classification of the African continent.

From Figure 2, we can conclude that the SNP and the UT are in Zone E. Figure 3 shows the average rainfall intensity for each zone at different time intervals.

From Figure 3, the smallest time interval is 0.001%, which equates to 5.25 minutes and the next interval is 0.003%, which equates to 15.75 minutes. Statistically, a few extreme rainstorms exceed 15 minutes and therefore, this paper will explore 0.003% as a moderate rainstorm and 0.001% as a heavy rainstorm. For zone E, a rain rate of 41mm/h and 70mm/h will be used respectively. In GEO services, the path length is static due to the static position of the earth station and satellite. However, in LEO, the constant movement of the satellites causes a moving path and varying path length. Figure 4 below shows the path length parameters in a static pointed earth station.

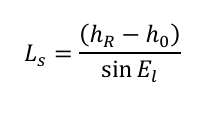
From Figure 4, The signal path through the rain (Ls) is the figure of merit in meter (m) that is used for the path length. The following equation (equation 1) is used to determine the path length Ls is as follows,
The Elevation angle (El) in LEO service is constantly changing as the UT keeps track of the satellites and switching between satellites. Figure 5 below shows the changing elevation of a UT as it keeps track of each satellite and then switches to the next satellite after 3 minutes.

Figure 5 shows two trends, one of which is the tracking trend between satellites (the smaller oscillating trend) and the second trend of the tracking trend between orbits (the larger oscillating trend). The last key parameter to determine the signal path is the Rain height (hr). Figure 6 shows the rain height (hr) as a function of the earth station position and rainfall intensity.
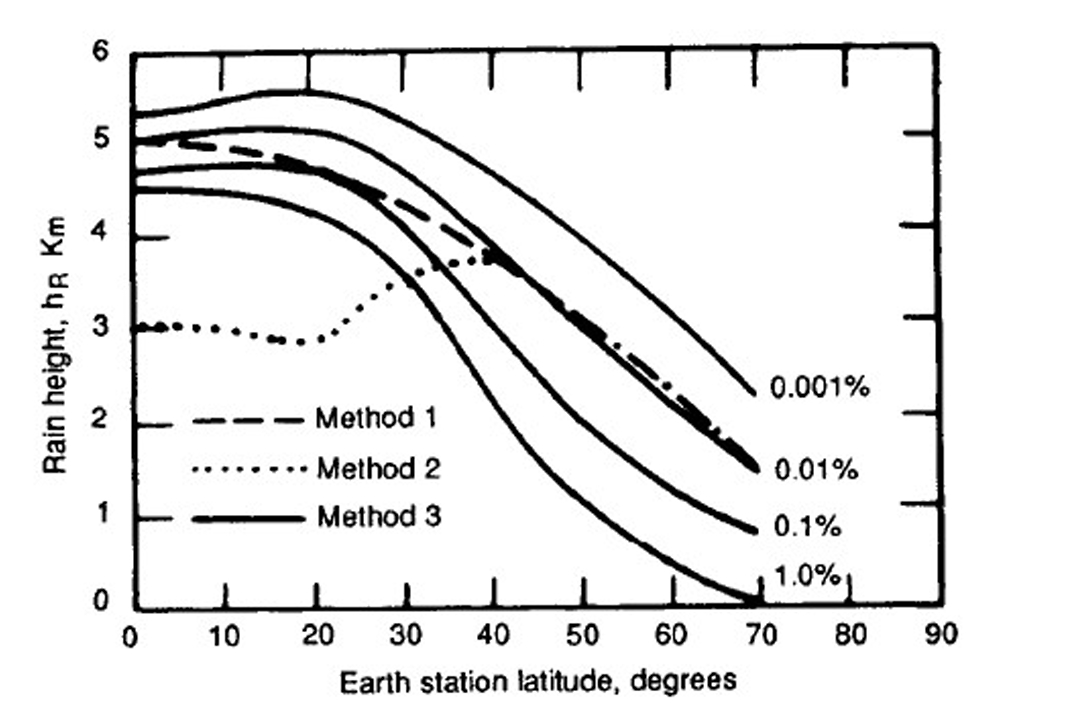
Figure 6 also shows the estimated rain height using three different methods; Method 1 is used for maritime climates; Method 2 is used for tropical climates; Method 3 is used for continental climates. For this paper, continental values will be used. The heigh above sea level (h0) is a value that can be obtained from the site location information. Using a constant rain height, and heigh above sea level, one can derive a graph showing the changing Signal path (Ls) according to its corresponding Elevation (El). Figure 7 shows a graph of the Signal path of a UT in Johannesburg.
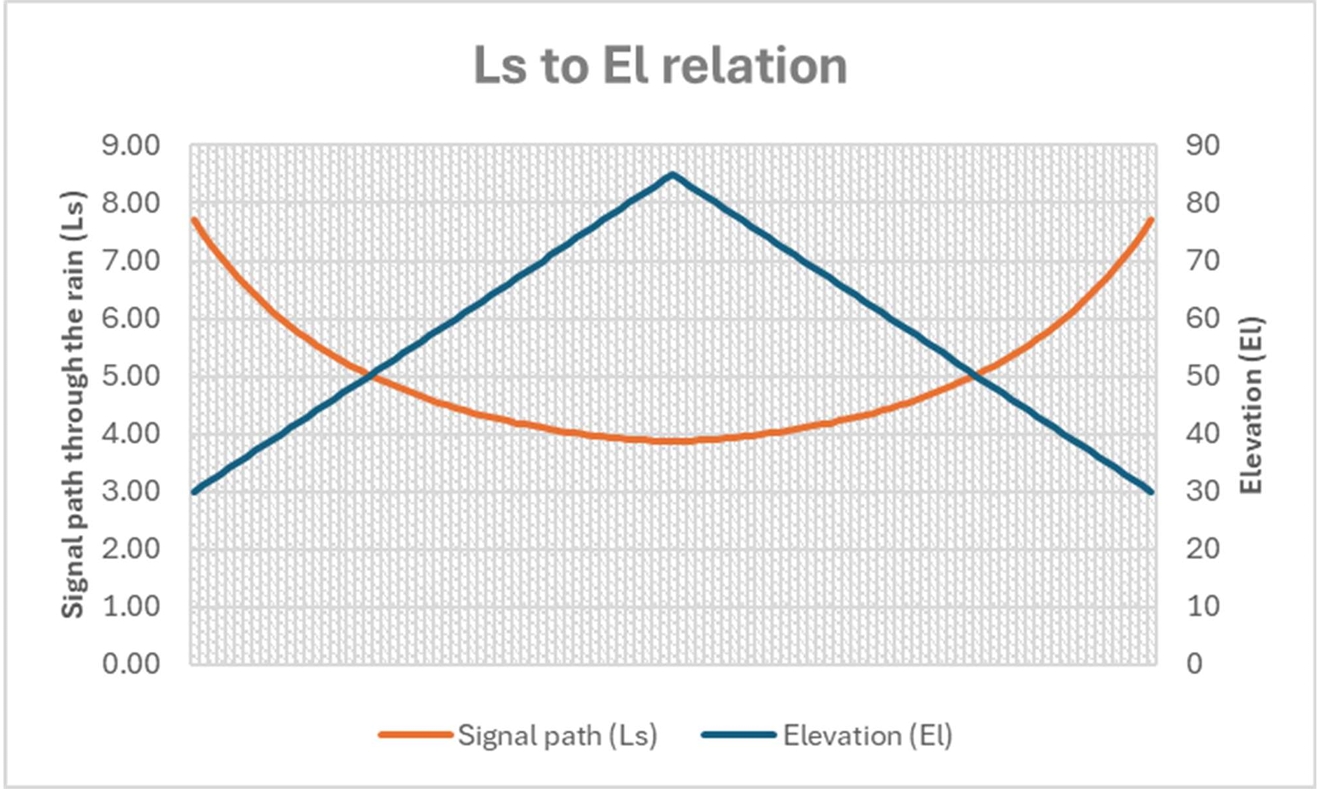
Figure 7 shows the best- and worst-case signal path according to the Elevation. At the lowest elevation of 30°, the signal path length is 7.7km and the highest elevation of 85° the signal path length is 3.86km. At the SNP the longest signal path is 7.36km and the shortest signal path is 3.69km. This means that during a rainstorm the rain fade attenuation will vary with the changing signal path. Equation 2 is used to determine the obtain the specific attenuation in dB/km:

Whereby a and b are the attenuation coefficients at specific frequencies and specific signal polarization. Figure 8 shows a table of the specific attenuation coefficients.

From Figure 8, the specific coefficient a and b are noted for vertical and horizontal polarization. To obtain the attenuation of the circular polarization, equation 3 is required.

Rp is the rain rate at the earth station measured in mm/h. Ls is the signal path through the rain. rp is the reduction factor from the function of the percentage time p and LG which is the horizontal projection of Ls in Figure 4. LG can be calculated as LG = LS cos El. Figure 9 shows the reduction factors for the different percentages of time,

For the UT operating in the Ku-Band frequency using circular polarization, the uplink fade is noted in Table 1.

For the SNP operating in the Ka-band frequency spectrum using circular polarization, the uplink fade is noted in Table 2.

The SNR (signal to noise ratio) of the OW50 UT varies from 3dB to 13dB as can be seen in Figure 10.
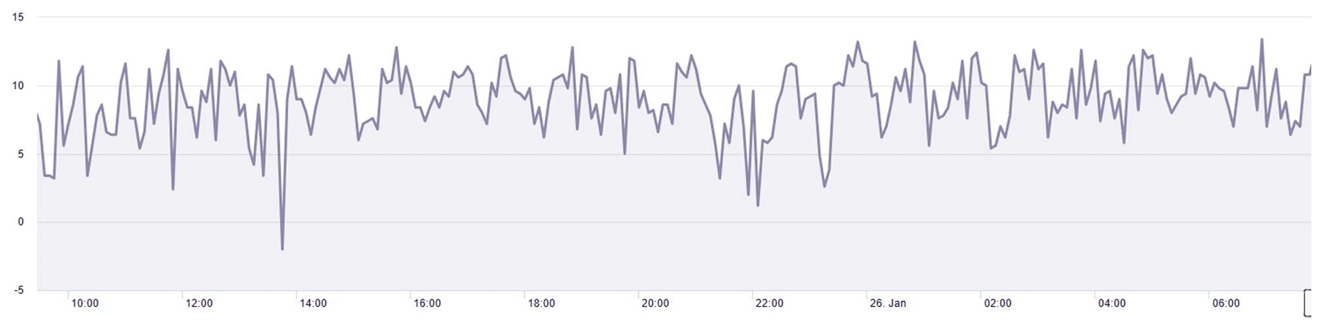
Figure 10 shows the varying SNR of a UT in dB. The expected fade due to moderate and heavy rain at both the UT and SNP are more than the SNR of the UT during clear sky conditions. Especially at best case look angle. This means that the UT will be offline for the entire time of the rainstorm.
Conclusion
The varying conditions of the LEO services makes the rain fade calculations more complicated than static GEO rain fade calculations. The OneWEB UT can experience 9.07dB to 11.22dB fade during a moderate rainstorm of up to 15 minutes. For heavy rainstorms, this range increases to 16.7db to 20.66dB. This range accounts for satellite handover at the UT. The OneWEB SNP can experience 26.98dB to 33.92dB during a moderate rainstorm. An outage caused by a moderate rainstorm at the SNP will affect the entire LEO network. The paper does not consider the level of uplink power control is installed at the SNP. The paper also does not consider the acquisition time after the UT lost connection with the SNP to get back into the network. Proper installation standards and accurate True-North calibration can mitigate the total outage.

